

Google Lighthouse
WGoogle Lighthouse is an open-source tool designed to enhance the quality of web pages. Through various audits, it evaluates web pages for performance, accessibility, progressive web apps, SEO, and other key metrics.
Key Features Include:
Section titled “Key Features Include:”- Performance Auditing: Measures page loading speed and overall performance, providing a score out of 100 and actionable improvement suggestions.
- Accessibility Auditing: Evaluates a page’s compliance with the Web Content Accessibility Guidelines (WCAG).
- SEO Auditing: Analyzes the page for SEO best practices, aiming to boost its search engine visibility.
- Progressive Web App Auditing: Assesses if a page qualifies as a Progressive Web App.
- Best Practices Auditing: Identifies potential areas for implementing web development best practices.
How We Use Lighthouse
Section titled “How We Use Lighthouse”We use Google Lighthouse mainly via the Chrome DevTools. To access these tools, right-click on a Chrome browser page and select “Inspect”, then select “Lighthouse” from the options menu at the top of the tools console:
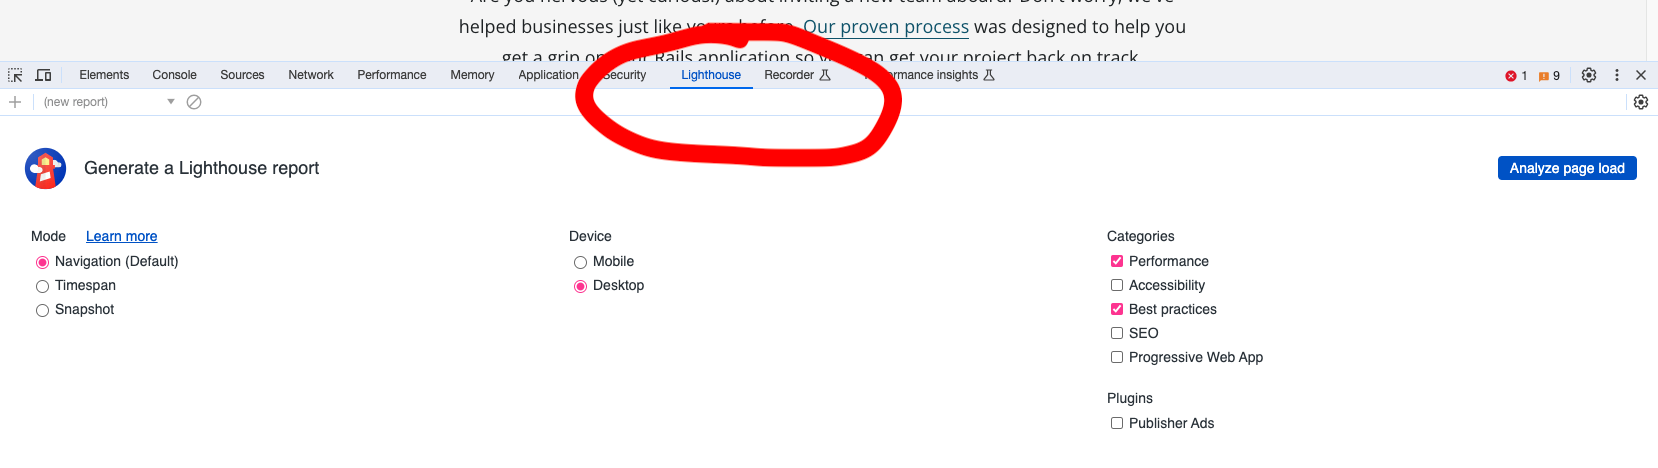
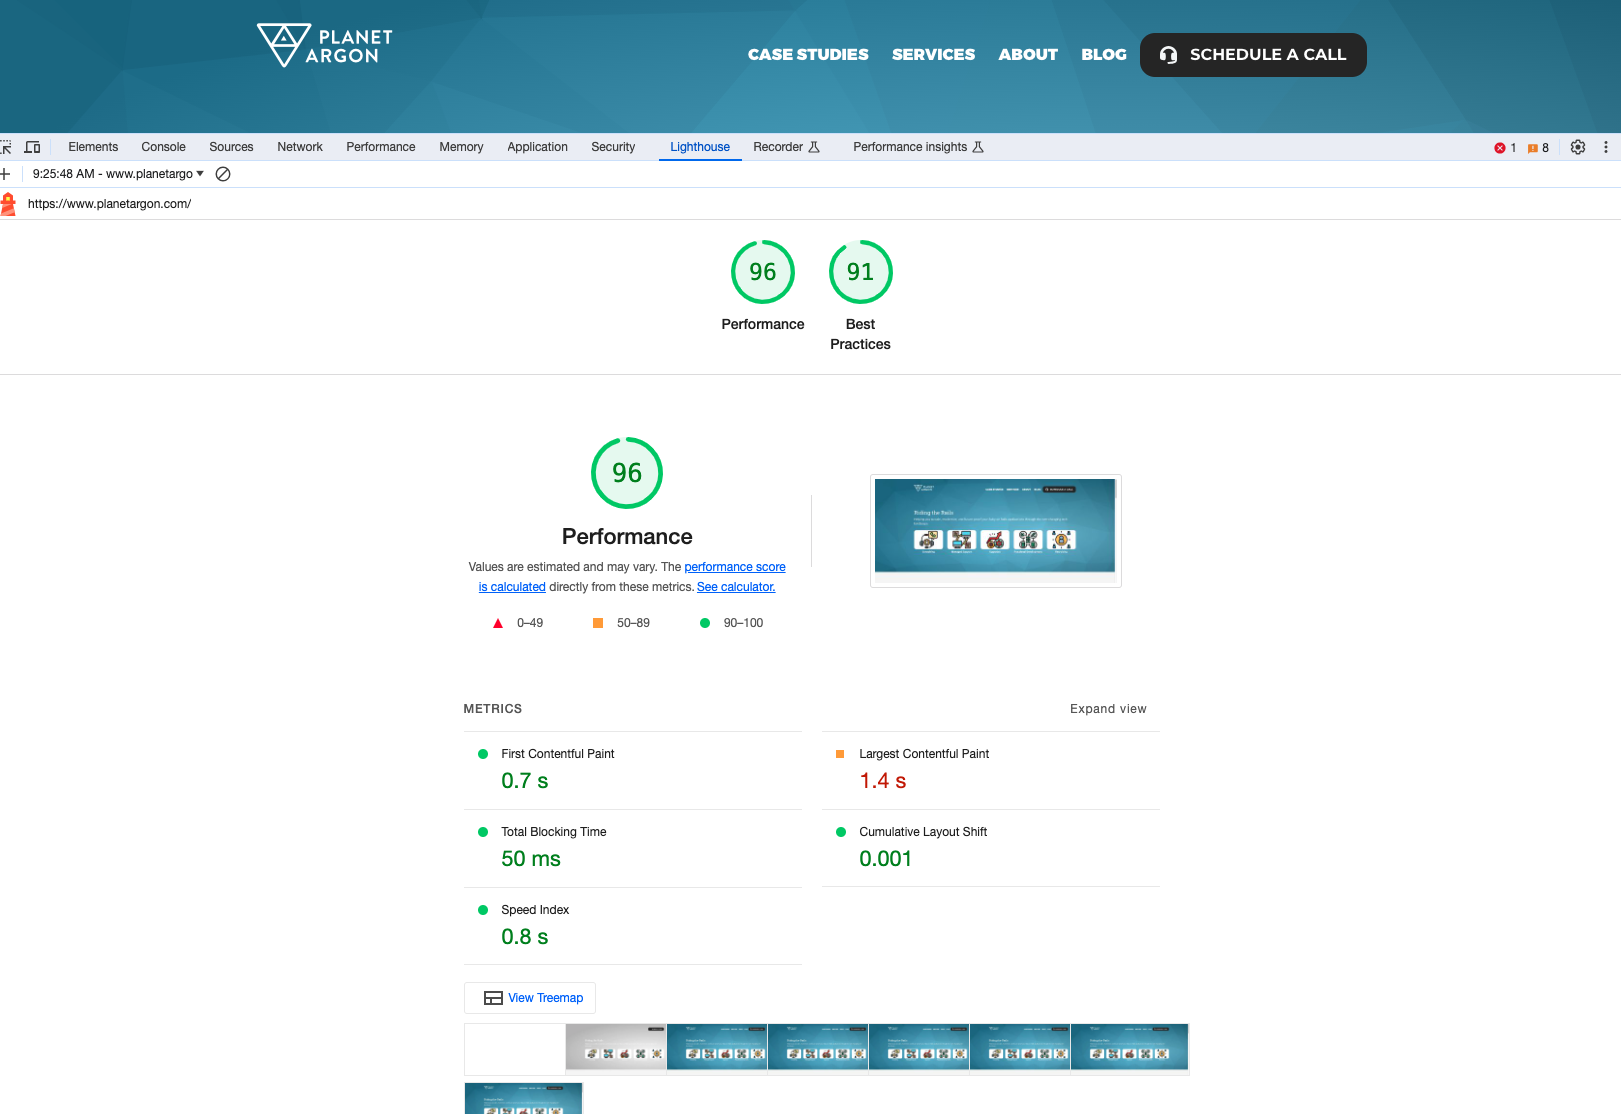
From there you can select the categories of reports you’d like to generate. Clicking “Analyze page load” reloads the page, collects the data on the load, and presents you with a summary of the reports for your selected categories:
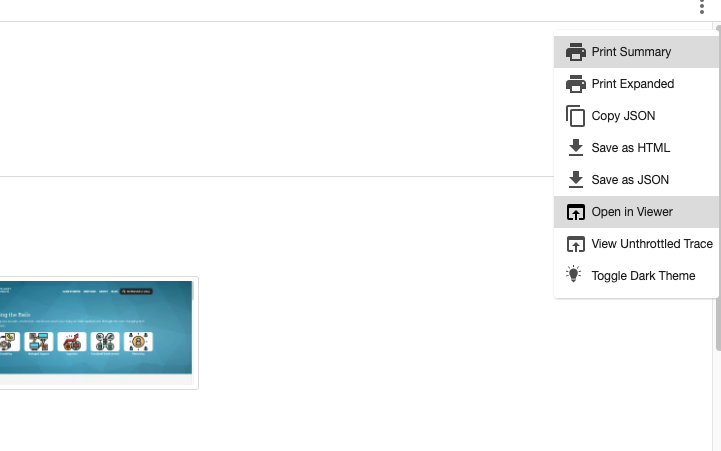
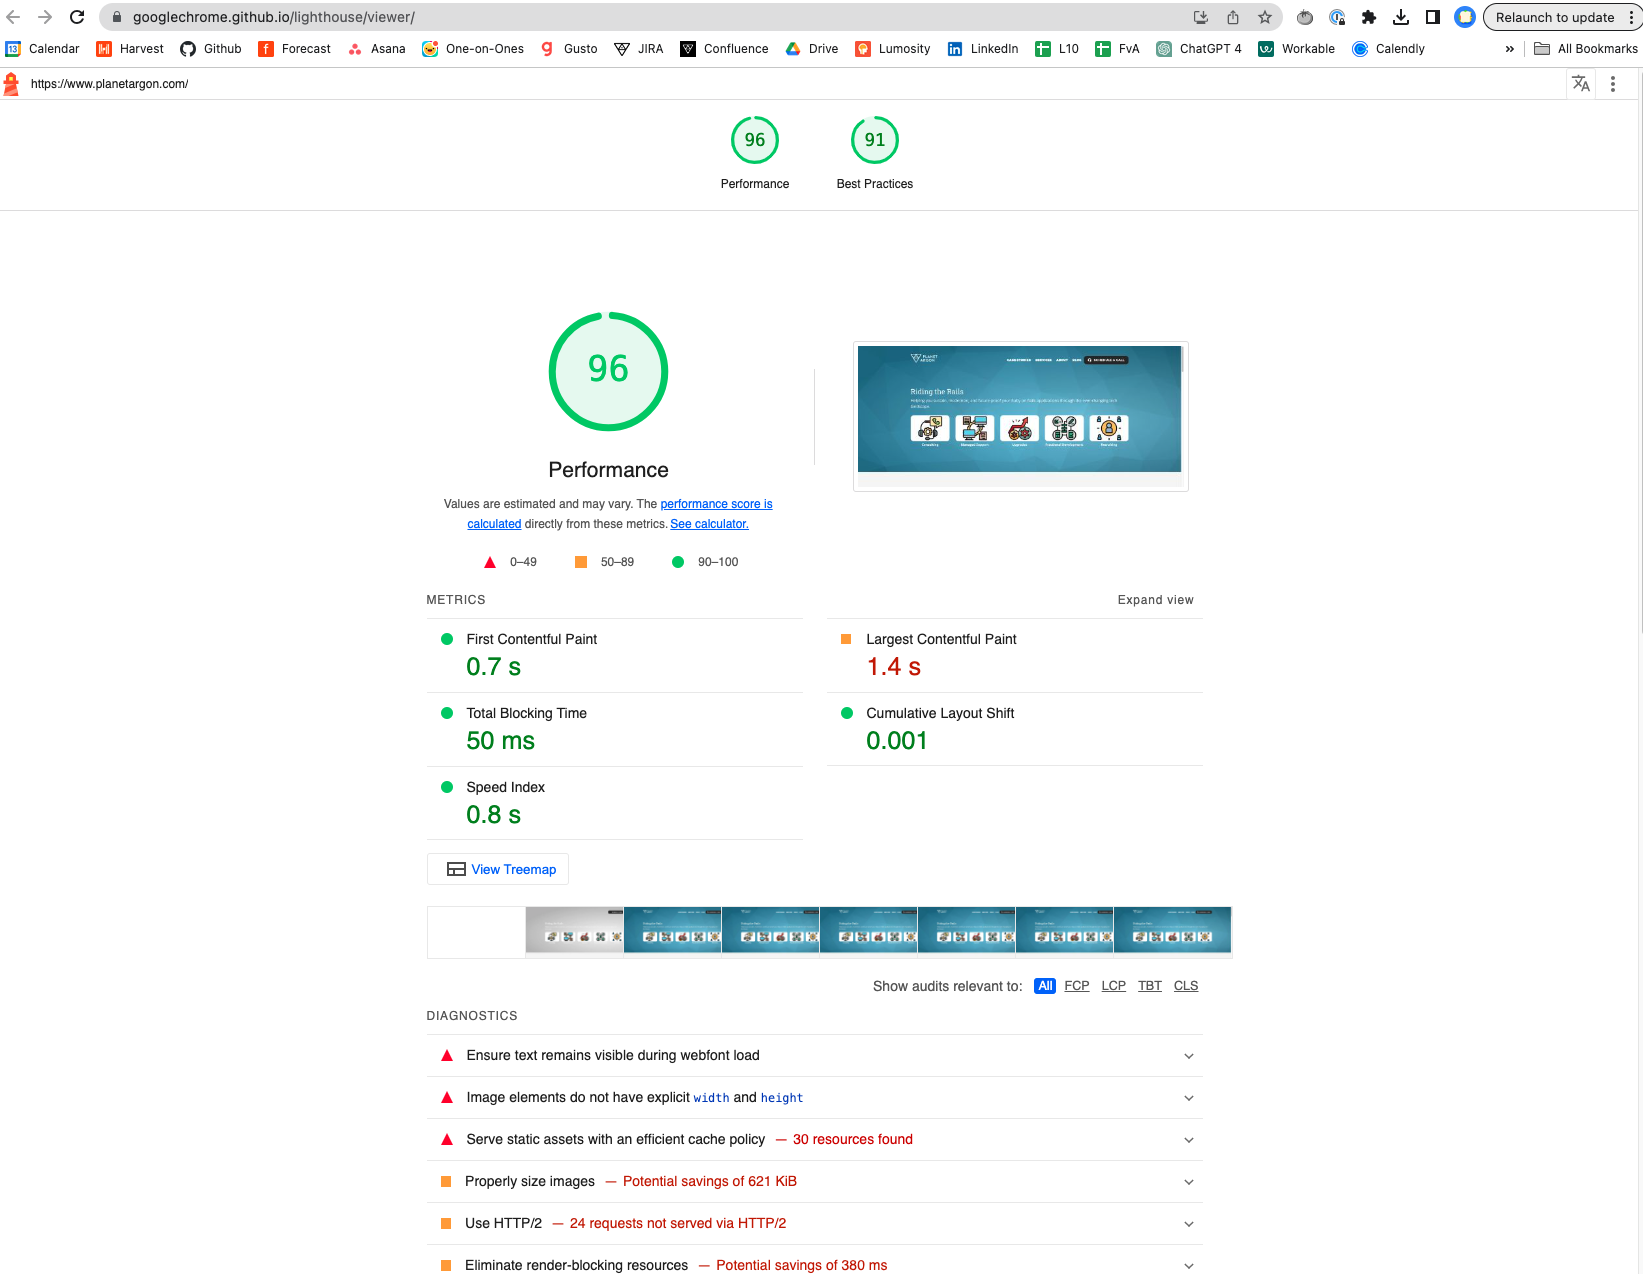
You can also open the reports in an expanded viewer in a new browswer window:
Performance Audits
Section titled “Performance Audits”As part of our monthly application monitoring checklist, we conduct regular performance audits. Below are the key elements we evaluate during a Lighthouse performance audit:
Metrics:
Section titled “Metrics:”- First Contentful Paint: Measures the time taken for the first content to be painted on the screen.
- Speed Index: Assesses how quickly page contents are visually populated.
- Total Blocking Time: Measures the total time a page is blocked from responding to user input.
- Largest Contentful Paint: Evaluates the time taken for the largest content element to get displayed.
- Cumulative Layout Shift: Measures unexpected layout shifts in the viewport.
Opportunities for Optimization:
Section titled “Opportunities for Optimization:”- Eliminate render-blocking resources
- Properly size and defer offscreen images
- Minimize CSS and JavaScript
- Efficiently encode and serve images in modern formats
- Enable text compression
- Reduce server response times, and much more
Diagnostics:
Section titled “Diagnostics:”- Address issues like large network payloads, inefficient cache policies, excessive DOM size, and minimize main thread work to enhance performance.
We use the reports on these elements to create improvement tasks in project backlogs. These tasks are accomplished as part of a project’s retainer or as part of a new project budget.
Accessibility (a11y) Audits
Section titled “Accessibility (a11y) Audits”We prioritize accessibility improvements and frequently run them both as independent projects and as segments of our application monitoring checklists.
Running an Accessibility Report in Lighthouse:
Section titled “Running an Accessibility Report in Lighthouse:”- Access Lighthouse through the Chrome DevTools.
- Provide the URL of the page you wish to audit.
- Lighthouse will run a series of audits against the page and produce a comprehensive report highlighting areas of improvement.
- Provide the report to the project manager and project technical lead. They will discuss the findings and create optimization issues in the Jira backlog to address the page’s accessibilty improvements.
SEO Audits
Section titled “SEO Audits”While we primarily focus on performance and accessibility audits, SEO improvements are occasionally incorporated, especially when they overlap with a11y requirements (e.g., alt tags). For a deeper dive into on-page SEO optimization, refer to the Lighthouse SEO documentation here.